


Activity tagging allows a Strava athlete that has recorded an activity to add another person to it that hasn’t recorded it.
Why is this important for growth?
Activity tagging is of great importance for growth as it simultaneously provides value to two parties, the business and the user.
Business Goals
Activity tagging solves a business need by providing athletes a tool to recruit friends they have a real-life commonality with (i.e. the activity they did together).
User Needs
Activity tagging allows athletes to obtain a record of their activity from a friend, should their recording be interrupted or fail to upload.
It all starts with a hypothesis
As with all the Growth projects, we started with a hypothesis.
Our hypothesis for activity tagging was that athletes have high intent to add friends that haven’t recorded, to their activities.
We chose to validate our hypothesis with an iterative approach, to ensure we’d learn at each step. Each phase of the project focused on one of the two sides of the experience, these being the activity owner (inviter) and the receiver (invitee).

Phase One • Invite to Strava
UX
We started by testing a simple mobile experience that allows athletes to invite others to Strava using the native share sheet directly from the activity page.
Our KPIs were:
Volume of invites sent.
New registration from invites.
Below is the flow from the activity owner’s side (the Strava athlete) and from the receiver’s side (the non-user).
Results & Learnings
As this feature didn’t previously exist there was no control group to compare to. For this reason, our generic invite UX – referred to as Invite Friends, was used for performance comparison (image below).
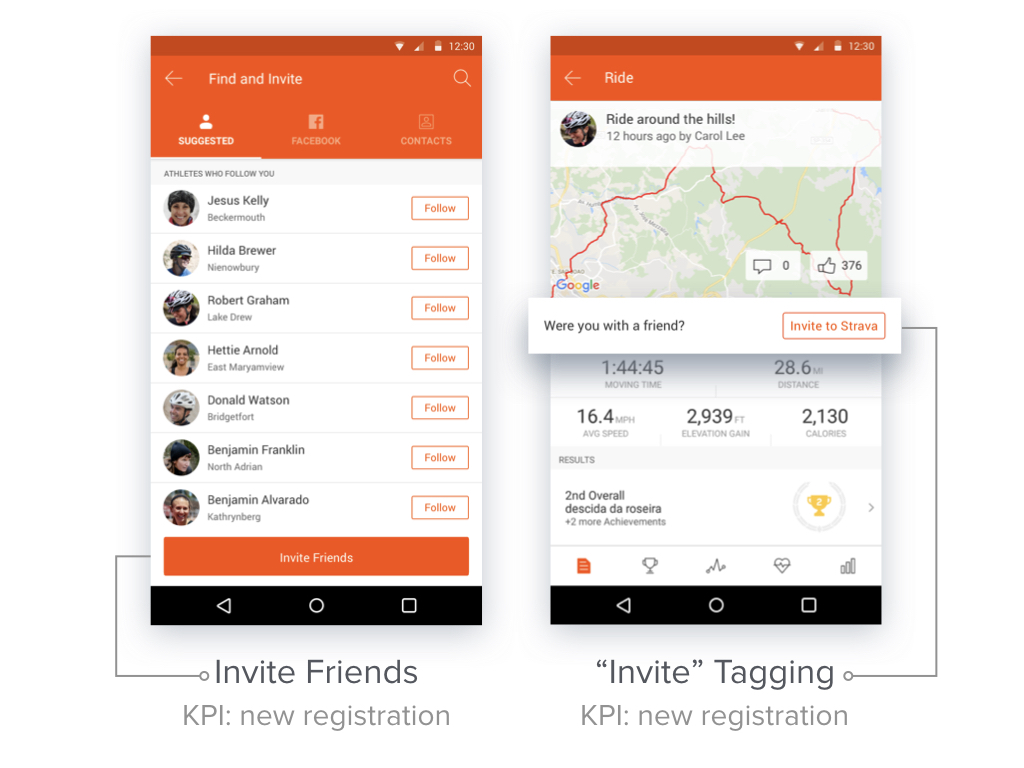
Activity (invite) Tagging yielded a 5x increase in outbound invite volume when compared to Invite Friends, resulting in our hypothesis being largely validated and further investment of design and engineering resources worthwhile.

Phase Two • Invitee Experience
UX
Following encouraging results from phase one, the team committed to a larger investment in the experience of the receiving party (i.e. the person being tagged).
On the receiver’s end, this meant ensuring the person being “tagged” would experience a personalized onboarding flow and then be able to save the activity to their own profile to make it theirs.
On the activity owner’s side, athletes would still be able to add friends to their run or ride by sending them a link from that activity’s page. During this phase, several copy and UI tests were also done on this side of the experience to increase adoption and engagement.

New user flow for phase 2 of activity tagging.
Our primary metrics for this phase were mainly focused on acquisition and activation. We were measuring, among all other metrics, the following:
Volume of activity tags to non-users.
Signups from activity tags (i.e. non-users that convert from an activity tag).
Tag acceptance rate (i.e. the percentage of users that after joining from an invite would accept and save the new activity).
Results & Learnings
Once statistical significance was reached, together with our data analysts we reviewed the results on the receiving experience (non-users and existing users).
We simultaneously monitored performance of the activity-owner experience to ensure our copy and UI tests were driving improvements. We learned the following:
Non-users (acquisition)
There is a small volume of tags sent to non-users.
Conversion rate (i.e. signup) from tags sent to non-users is low.
Strava athletes
The largest volume of tags is sent to existing Strava athletes via a link through the share sheet / share extensions (non -optimal UX).
The likeliness of an activity tag being accepted from an athlete is very high (95%).

Phase Three
Following these learnings, we chose to focus our efforts on the top of the funnel.
Inside the app, by increasing adoption by Strava athletes; while on the unauthenticated side by increasing conversion rate on the non-users receiving an activity tag.
Simultaneously we improved the experience for adding athletes from your network and retired the previous link sharing experience (section below).
Phase3 • Improve Add Friends UX
In phase two we learned that in 2 out of 3 cases athletes were already adding their Strava friends by sending them a link.
Additionally through face to face usability studies this friction in the experience had been confirmed.
This improvement was twofold: a UI to add friends from one’s Strava network would provide an optimal experience while increasing ease of attribution when analyzing data (i.e. visibility into who a tag was sent to).
Phase 3 • Increase Conversion External Tags
In phase two we learned that external invites were not resulting in a large volume of people joining the platform to view and accept the activity tag they’d received.
Our hypothesis was that by removing friction represented by the App Store, in favor of surfacing content of the invite upfront, would show significant increase in conversion.
To achieve this, a non-user receiving an external invite link would be redirected to a mobile web view of the activity they’ve been requested to be added to.
The friction represented by the App Store and subsequent download would be delayed to later in the flow and greater value to join would be surfaced upfront (image below).

The experience provided non-users insight into the content of the invite, such as the map and route, basic stats of the activity and an overview of others that were part of the workout.
Altogether these elements would aid the person in making a more informed decision to download and join Strava.
Results & Learnings
Traffic from external invite links was split between the control (redirect to App Store) and the variant (redirect to mobile web view) and after statistical significance was reached, results were discussed as a team.
Unsurprisingly the variant experience showed a 3x increase in conversion.

The biggest takeaway from this test is that providing sufficient amount of value upfront will result in higher intent to act. This may have lasting and measurable effects on the athlete’s life cycle as now the act of joining carries greater intent which may result in a more engaged user in the long term.
Conclusion
Activity tagging was a feature at the intersection of the athlete and the business.
Through an iterative approach that combines speaking to our athletes, building experiments, measuring results and learning along the way, we can continue to ensure we are shipping performant and valuable experiences to our athlete base.

Thank you for reading